


Received 12 January 2018; Revised 16 April 2018, 22 May 2018; Accepted 12 June 2018
Łukasz Bryl, Ph.D., Department of International Economics, Poznan University of Economics and Business, Al. Niepodleglości 10, 61-875 Poznań, Poland, e-mail: This email address is being protected from spambots. You need JavaScript enabled to view it.
Abstract
In the knowledge-based economy, long-term corporate performance and its competitive advantage are strongly associated with human capital. Theoretical deliberations suggest that companies with greater human capital orientation (higher salaries and benefits, more training, a transformational leadership style, better equipment) might perform better than their peers with less human capital orientated strategy due to: higher skills of employees, greater motivation and thus higher overall corporate effectiveness. On the other hand, orientation towards human capital generates higher costs which may negatively affect profitability and stock market valuation. There are two aims of this paper. The first one is to state whether human capital orientated firms generate positive financial performance. The second aim is to compare financial performance of human capital orientated firms with the benchmarking sample to state if the financial performance is above-average. Research was conducted on a sample of 7,204 unique publicly listed companies from the American stock market within a ten year period (72,040 firm-year observations). Empirical studies were carried out with the help of one hypothesis. Two groups of companies were created and their results on financial performance were compared. The first group consisted of human capital orientated firms that were identified with the help of the well-known 100 Best Companies to Work For listing, in line with the Edmans (2009) approach. The second group composed of US-based publicly listed entities from 11 industries. Analysis was conducted for the 2007-2017 years. The key findings of the paper are: strategy based on human capital orientation provides high profitability and leads to above-average financial performance, mainly in the field of equity growth and stock market valuation. The paper has significant practical implications for investors in terms of possible directions of stock market investments aimed at achieving above-average returns as well as for corporate management by indicating that human capital orientation pays off. The paper fills the research gap between two points. First, it states in which financial performance pillars human capital orientated firms perform best. Second, it compares the results of the human capital orientated strategy with the entities from the 11 different industries. Research refers to the American publicly listed enterprises.
Keywords: knowledge-based economy, human capital, financial performance, multinationalities.
INTRODUCTION
Traditional human relations theories (e.g., Maslow, 1943; Hertzberg, 1959; McGregor, 1960) do not perceive employees as a cost or commodity required in the production process, but rather as a key organizational asset, who are able to create substantial value by launching new products or building sustainable relationships within and outside the entity. In this sense, employees’ knowledge and skills should be described as a “form of capital” (human capital). The notion of human capital was first introduced by Schultz (1961). He described human capital as a set of knowledge, skills and abilities that exist in the individual and that are used by him/her. As many authors (Guenther, Beyer, & Menninger, 2003; Huselid, 1995; Pfeffer, 1994; Prahalad & Hamel, 1990) state, an organization’s human capital should be perceived as a valuable resource and as a key factor for corporate competitive advantage. Apart from knowledge, company individuals’ competence, skills, experience, expertise and capabilities form human capital (Mention & Bontis, 2013). When the people in an organization acquire new knowledge, the value of the company and its intellectual capital (including human capital) are enriched (Vidotto, Ferenhof, Selig, & Bastos, 2017). As argued by Ndinguri, Prieto, and Machtmes (2012) from the perspective of knowledge, human capital has become a key resource for the organization to achieve strategic competitive advantage and thus better performance because it is difficult to be imitated. On the other hand, human capital orientation may result in increased costs in the form of higher salaries and additional benefits, as employees perceive themselves as specialists with unique expert knowledge and thus have greater earnings’ expectations and employment conditions. As a result, this may lead to lower cash liquidity and a potential loss of competitive advantage.
The aim of the paper is twofold. First, to state if, and to what extent, human capital orientated firms (employee friendly) are profitable in the long term. Second, an attempt was made to compare the performance of human capital oriented entities with the results of a broad sample of companies from different industries. The research methods adopted for this study are comparative analysis and tools of descriptive statistics.
The structure of this paper is as follows: Section 1 is an introduction which leads into the literature review on human capital and prior research in Section 2. The methodology used in the study is set out in Section 3 while Section 4 outlines the results. Section 5 is the discussion which is followed by Section 6 pointing to conclusions and limitations of the study, along with the future lines of research.
LITERATURE REVIEW
Human capital orientation - characteristics
As in the contemporary business environment, high-skilled labor is aware and capable of the need for ongoing learning, and employees strive for developing greater knowledge to respond to market competition, product innovations and more complex technologies (Appelbaum, Bailey, Berg, & Kalleberg, 2000; Batt, 2002; Snell & Dean, 1992). However, according to Stewart (1999), some employees, by no doubts, should be perceived as valuable assets, but others are only costs (often significantly high). This situation may refer not only to the entire firm but also to selected departments. As a result, Sveiby (1998), when analyzing professional and organizational skills, provides a classification of four types of employees: professional, manager, leader and support personnel. Nevertheless, two types of firms can be still distinguished based on their approach towards employees. According to Kochan and Dyer (2017), one of them can be defined as a low-road strategy firm, with the second as a high-road strategy enterprise. The features of these definitions are shown in Table 1.
Table 1 provides a clear distinction between the two types of firms. Although the first type (described as a low-road strategy) seems to be associated with industrial economy, while the second one (high-road strategy) with knowledge-based economy, in fact, both of them can achieve and preserve sustainable comparative advantage in the contemporary economy. In the case of the low-road strategy, competitive advantage derives from the fact that entities tend to minimalize the costs (mostly those related to employees) which results in relatively lower prices of products and services than the competition. In turn, in the second approach (high-road strategy), firms strive to invest in their employees to increase their satisfaction, commitment and skills, which hopefully will lead to higher efficiency, lower rates of employee turnover, and/or better quality products and services, and thus a competitive advantage based on quality.
In high-road companies, the application of work teams is expected to result in greater adaptability, productivity and creativity, and to provide more innovative and comprehensive solutions to companies’ problems (Beers, 2005).
Table 1. Low-road strategy vs. high-road (human capital orientation) strategy
|
Low-road strategies |
High-road strategies |
|
|
Employees perception |
costs |
valuable resources |
|
Selection of employees |
casual; minimum standards |
careful; high standards |
|
Job/work design |
very specialized |
multiple tasks |
|
Skill level and scope |
low, narrow |
high, wide |
|
Training |
limited; job specific |
extensive; employee development |
|
Job autonomy/discretion |
low |
high |
|
Hierarchy |
rigid differentiation between managers and workers; many managerial layers |
low differentiation between managers and workers; few layers |
|
Wages |
relatively low wages |
relatively high wages; additional rewards linked to performance |
|
Motivation |
extrinsic; focused on company control of workers |
intrinsic; focused on self-control |
|
Employee attachment to company |
minimal |
extensive |
|
Employee voice |
little or no voice or engagement; representation suppressed |
informal and/or formal voice; options for engagement and representation |
Source: Kochan and Dyer (2017).
Moreover, the promotion scheme is more fair and transparent, as the employees are encouraged to take part in the decision-making process within the organization, either individually or collectively. As a result, their personal attachment to the firm is greater, which is strengthened by attractive remuneration, additional benefits related to their performance, and more general and specialized training directed at personal development. Consequently, employee job satisfaction and involvement increases which may positively influence general corporate performance. The low-road strategy is the opposite of high-road strategy.
Other terms used to distinguish between two opposite strategies is the approach of Roos, Bainbridge, and Jacobsen (2001) who distinguished the following two types of enterprises: process-oriented and people-centered companies. Such division redefines the approach towards employees and their retention rates. In the process-oriented firms, high labor turnover was unimportant as employees performed unskilled tasks. By contrast, in the people-centered entities employees are the key sources of value creation, especially in modern knowledge-based industries, so keeping them in the firm is of crucial importance. In the people-centered companies retention rate should be minimalized (as talents are scarce and recruitment costs are high), whereas in the process-oriented firms retention rate may be relatively high, as employees perform simple and easy to duplicate tasks (so finding new ones should not be an obstacle) and personnel salary expectations rise slower.
Theoretical deliberations on human capital and its importance lead to the conclusion that conducting human capital orientated strategy is one of the possible ways of achieving sustainable competitive advantage. Moreover, although entities with the greatest levels of human capital awareness may be described differently, the literature provides a common general framework of companies being human capital oriented.
Human capital orientation and firm performance – theoretical deliberations
As human capital orientation is a complex phenomenon and can be analyzed with the help of numerous factors, this article concentrates on the following dimensions: investment in human capital, high skills, team performance, job satisfaction, organization commitment, citizenship behavior, and employee involvement.
Theoretical considerations on the relation between human capital investments and corporate performance lead to several crucial implications. According to, e.g., Oviedo-Garcia, Castellanos-Verdugo, and Sancho-Mejías (2014), knowledge is the most important resource, and its management plays a key role in a firm’s performance. Consequently, investments in human capital may increase employee productivity and financial results (Black & Lynch, 1996; Pfeffer, 1998; Snell & Dean, 1992). Similarly, Durrani and Forbes (2003) reinforce these arguments by suggesting that company success is strongly related to the investment flow in human capital and information technology. Moreover, investment in people results in improved individual performance; increased organizational productivity; and economic development; as well as other societal benefits (Lynham & Cunningham, 2006; Nafukho, Hairston, & Brooks, 2004). As the level of human capital is increased, people develop more productive means of performing tasks, thereby increasing the overall efficiency of an entity. Black and Lynch (1996) proved that the average educational level in companies is positively related to their business efficiency. Moreover, as Appelbaum et al. (2000) suggest, high skills of the employees are a requirement for empowerment and benefit from delayering the company, which in turn is fostered by a strong approach to develop team performance among the employees. As Crawford and LePine (2012) and Mathieu, Maynard, Rapp, and Gilson (2008) state, effective team performance must go in line with the coordination of team members’ activities. Synergistic value from teams is difficult for competitors to imitate. Thus sustainable competitive advantage derives more from teams than from individuals (Barney & Wright, 1998). The efficiency and effectiveness of the team’s collective learning process are positively influenced by the interaction of team members with each other and, moreover, knowledge and abilities gained by one team member can be transferred to the other team members (Ellis et al., 2003). However, as stated by Chan, Lim, and Keasberry (2003), it is possible only when teams in the firm learn through the sharing of knowledge and experience among individuals.
Human capital (as an intangible resource) is more probable to provide a competitive advantage because it is rare and socially complex, and therefore difficult to copy (Hatch & Dyer, 2004). Also, Groot and Van Den Brink (2000) state that human capital can improve firm performance through its contribution to the firm’s flexibility - investments in human capital improve employability and therefore labor mobility. According to Lepak and Snell (2002), one advantage of this “resource flexibility” is the increase in the ability of the organization to deploy its labor effectively, and thus, improve firm performance. Human capital orientation may also increase employee motivation for work; thus they are more involved in task performance and understand better the vision of the company. More satisfied employees are more willing to undertake additional tasks, support the implementation of the organization’s goals, as well as have a higher level of effective organizational engagement. Satisfaction from work is positively related to the employee’s attitude and the level of performance of their tasks (Meyer, Allen, & Gellatly, 1990). Studies (Culverson 2002) confirm that employee commitment is an extremely important factor that allows the organization to function effectively and contributes to its success. Indeed, the involvement of the organization’s human resources is the basis for its further growth and development. As suggests Randall (1987), commitment to an organization shows the relative scope of an individual’s identification to the company and involvement in that organization. According to Luthans, McCaul, and Dodd (1985), organizational commitment can be described as having three major components: First, an individual’s strong belief in and an acceptance of the firm’s goals; second, an individual’s eagerness to perform substantial effort on behalf of the company; and finally, an individual’s definite willingness to maintain membership. This is confirmed by Loi, Ngo, and Foley (2006) who state that employee organizational commitment is negatively related to an intention to leave. As a result, firms with committed employees have low turnover rates (Allen & Meyer, 1990) which links to lower costs of recruitment and training. In several studies, job satisfaction and organizational citizenship have been found to be negatively correlated with turnover intention (Tsai & Wu, 2010; Huang, You, & Tsai, 2012). Smith, Organ, and Near (1983) were the first to define the term “organizational citizenship behavior,” as a kind of non-organizational formal regulation and behavior that could not be assessed by a formal reward and punishment system. Podsakoff, Ahearne, and MacKenzie (1997) argued that citizenship behavior is a three-dimensional notion that takes into account the dimensions of “helping,” “civic virtue” and “sportsmanship.” Organ, Podsakoff, and Mackenzie (2005) explained that organizational citizenship promotes effective functioning of firms because of the increased level of commitment.
Employee involvement is crucial for survival in a world of accelerating change and increasing competitiveness (McConville, 1990), as ideas can derive from anyone, at any level, anyplace, anytime (McConville, 1990; Madjar, 2005). Consequently, employees should be motivated and encouraged for their personal involvement (Fairbank & Williams, 2001; Alves, Marques, Saur, & Marques, 2007; Neagoe & Klein, 2009). The most common goals of achieving greater employee involvement are:
- greater “tangible” benefits such as cost savings, sales increases and/or intangible advantages like higher levels of morale (Du Plessis, Marx, & Wilson, 2008). “Tangible” benefits usually result in a measurable increase in profitability;
- greater “intangible” benefits that usually relate to items such as: working conditions, employee safety, public relations or internal communication. They do affect profitability but not in a direct way (Islam, 2007);
- fostering creativity, to enhance emerging new ideas and to boost innovations, so that workplace performance is improved, and commitment and accountability among employees are increased (Buech, Michel, & Sonntag, 2010; Fairbank & Williams, 2001; Islam, 2007; Arthur, Aiman-Smith, & Arthur, 2010).
The theoretical assumptions presented above on the relation between human capital and firm performance confirm the position adopted by e. g. Shane and Venkatraman (2000) stating that the enhancement of human capital firstly enables an increase in the ability of employees to perform their daily tasks of discovering and exploiting business opportunities better (due to numerous above mentioned factors), which subsequently, positively influences financial performance (Cooper, Gimeno-Gascon, & Woo, 1994; Gimeno, Folta, Cooper, & Woo, 1997). In addition, it should be stated that employee satisfaction is one of the accepted measurement methods of firms’ human capital orientation.
Human capital orientation and firm performance – review of empirical studies
There are numerous empirical studies demonstrating the impact of human capital and human resources management practices on performance (Ashton, 2005). Some focus on the workforce itself (Carmeli & Tishler, 2004; Gupta, 1984; Gupta & Govindarajan, 1984), while others conduct deeper analysis, by studying the human resources management practices intended to develop and exploit human capital for better performance (Arthur, 1994; Delaney & Huselid, 1996; Youndt & Snell, 2004). Sánchez, Marín, and Morales (2015) found that strategic human resource practices influence employee behavior and generate positive effects on corporate performance. A study by Edmans (2009) on a sample of the 100 Best Companies to Work For in America listing, during the period 1984-2005, suggests that employee satisfaction is positively correlated with shareholder returns (long-run stock returns) which is consistent with the human capital-centered theories of the enterprise. In turn, the link between team learning and innovativeness has been found in a study by Edmondson, Bohmer, and Pisano (2001), who proved that learning-orientated firms were better at implementing innovative technology. Moreover, Bunderson and Sutcliffe (2002) found that team learning orientation (technically measured with the help of surveys) were associated with observed process and product innovations.
Furthermore, a study by Seleim, Ashour, and Bontis (2007) on 38 Egyptian software companies, states that firm performance (due to the lack of reliable data measured by export intensity) is most influenced by a high level of human capital, understood as high skilled developers who possess distinct capabilities such as intelligence, creativity, initiation, and ambition. Such perceived human capital in software firms can introduce unique and smart software products and services that provide a profitable local and international base of customers. Research by Seleim et al. (2007) confirms previous theoretical considerations by Lepak and Snell (1999), Sveiby (2007) and Stewart (1999) that not all employees possess knowledge and skills of equal strategic importance for the firm. Thus, it is crucial to measure human capital effectiveness. A study by Nimtrakoon (2015) on 213 ASEAN technology listed entities, suggests that firms with greater human capital effectiveness perform greater ROA and higher stock returns. Similarly, studies by Bryl and Truskolaski (2015) on a sample of Polish listed IT companies, indicate human capital as the most important factor in the creation of high market value, positive ROA, but also ROE. However, research on a sample of 151 listed entities from Hong Kong (five industries: commerce, utilities, industry, properties and finance) by Yu, Ng, Wong, Chu, and Chan (2010) provide opposite conclusions. Human capital effectiveness was found to be negative and a very highly significant predictor for market value, which means that the greater the employee expenses, the lower the market valuation of the company. In this sense, investors value human capital orientated firms lower and treat employee expenses as costs, which is inconsistent with the contemporary human capital theories and studies. As a result, a firm’s financial performance may be evaluated by stock exchange valuation, profitability and growth. Based on the literature review the research hypothesis adopted in this paper is as follows:
H1. Human capital orientated firms achieve above-average financial performance.
RESEARCH METHODS
Sample selection and description
Some studies (Sels et al., 2006; Way, 2002) argue that the cost of investment in human capital in the case of small firms often outweighs the gains that they might have from performing high human capital, because of the fact that small firms do not receive as many benefits from economies of scale as large firms do. Considering that approach, the sample studied in this paper will comprise of large entities only. However, identifying a human capital orientated firm is not an easy task. One of the approaches is to utilize a well-known tool, called 100 Best Companies to Work For which is created by Fortune each year. A similar approach has been adopted by Edmans (2009). A survey is carried out among more than 230,000 people employed by American companies in the US and worldwide. According to the official methodology, employees evaluate their satisfaction by anonymously answering the questions concerning their workplace, including the quality of their leaders, support for their personal and professional lives, and their relations with colleagues. Moreover, 100 Best Companies to Work For scores details such as compensation and benefits, hiring practices, recognition, training, and diversity programs. As a result, it is a relatively complex tool, which takes into account most of the important features of the human capital orientation strategy. Examples of the questions, on which the survey is based, are presented in Table 2.
As there are in total 50 questions measuring the level of the employees’ satisfaction, in table 2 there are shown only the randomly chosen ones. Employees answer the questions, providing a score concerning directly their satisfaction level on a 1-5 Likert scale (4 = often true and 5 = almost always true, are both classified as high satisfaction).
Table 2. Examples of the questions concerning employee satisfaction utilized
in the 100 Best Companies to Work For survey
|
Question (Likert scale (1-5)) |
|
People avoid politicking and backstabbing as ways to get things done. |
|
Promotions go to those who best deserve them. |
|
Managers avoid playing favorites. |
|
Everyone has an opportunity to get special recognition. |
|
People here are paid fairly for the work they do. |
|
I am treated as a full member here regardless of my position. |
|
If I am unfairly treated, I believe I will be given a fair shake if I appeal. |
|
People look forward to coming to work here. |
|
This is a psychologically and emotionally healthy place to work. |
|
People are encouraged to balance their work life and their personal life. |
|
Management shows a sincere interest in me as a person, not just an employee. |
|
People care about each other here. |
|
I can be myself here. |
Source: own elaboration based on the 100 Best Companies to Work For methodology.
However, it should be noted that the level of satisfaction is the output score of other key elements of the human capital orientation. By utilizing this tool, research is focused on studying the following components of human capital orientation mentioned in the theoretical part of the paper which are: organizational citizenship, team performance, individual commitment and personal development. In addition, the 100 Best Companies to Work For Survey refers to the 14 main industries (Figure 1).
Figure 1 shows that the studied sample is highly diversified, thus upcoming results potentially enable for generalization. In the listing, the most common industries are Professional services (18 entities) and Financial services and insurance (17 firms). Total employee counts are global (2,256,892). Job openings are the U.S. only. In 2017, the largest firm in terms of a number of employees was FedEx (268,784), while the smallest was Pinnacle Financial Partners (1,206). 100 Best Companies to Work For list has been selected as the representative of human capital orientated firms and is used in this study. Their results have been compared with the performance of the largest US publicly listed entities from all industries. The benchmarking sample consisted of total 7,245 entities from 11 industries.
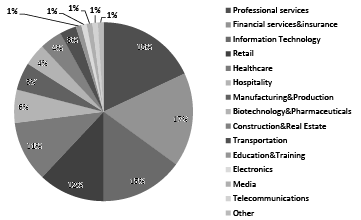
Figure 1. 100 Best Companies – Industry breakdown
Source: retrieved 12 December, 2017, from http://fortune.com/best-companies/.
Tools of descriptive statistics have been used in the study. In the case of mean values, a weighted average has been applied.
Time extent and sources of data
For the purposes of the study, a comparative analysis covered a ten year period (2007-2017). However, human capital orientated firms have been chosen from the listing in 2012 and 2017: thus two groups have been formed and their results have been compared with the benchmarking entities from 11 industries (energy, materials, industrials, consumer discretionary, consumer staples, healthcare, financials, information technology, telecommunication service, utilities and real estate, respectively). Some human capital orientated firms from the list of 100 Best Companies to Work For have appeared in the benchmarking group. Thus they have been excluded from the benchmarking sample. Note that in the case of both analyzed groups, the study period amounted to 10 years. Data has been obtained from the Thomson Reuters Eikon Database.
100 Best Companies to Work For 2012 vs. 2017 listing
For the purpose of greater generalization human capital orientated firms have been omitted from the two listings: 2012 and 2017. Comparative analysis of both listings showed that their level of similarity (in terms of the same enterprises being on both lists) is 51%. In other words, 51 of the same entities were observed on the 2012 and 2017 listing. As the study list encompassed public and private companies, and it was only possible to find reliable data in the case of publicly listed entities, the sample had to be reduced to 52 and 45 firms for the 2012 and 2017 listing respectively.
Performance measurement, assumptions and adjustments
To compare the performance of firms, their financial results have been divided into the three pillars: stock exchange performance, profitability and growth. As the period of analysis covered the global financial crisis of 2008, major fluctuations have been observed in the initial stage of the study. To avoid misinterpretation of data, extreme values (outliers) have been identified and excluded from the study. To evaluate the stock exchange performance, the share price on the 1st January 2007 has been compared with the share price on 1st January 2017. Profitability has been measured with ROA, ROE and ROS using net income (after tax) as a numerator. All absolute values greater than 100% have not been counted in the study. Growth has been evaluated by the increase in revenue, book value of the equity and net income from the 2007 to 2016 financial year.
In addition, out of the 100 companies initially designated for study, several of them had to be excluded due to the fact of not being publicly listed and thus it was not possible to obtain reliable data. In fact, the exclusion rate in the human capital orientated firms was quite high. It amounted to 55% in the case of the 2012 listing and 48% in the case of the 2017 listing. As a result, the total number of the studied human capital orientated entities was 45 in the 2012 list and 52 in the 2017 list (see Appendix 1). As previously mentioned, some companies from the 2012 list appeared on the 2017 listing, so the total number of unique human capital orientated enterprises amounted to 49.
RESULTS
Table 4 presents the general results of the conducted study. In line with the recent literature, the result shows that human capital oriented firms are not only profitable but also perform better in all studied fields than the benchmarking sample.
In the case of human capital oriented firms, their performance measured by the increase in the share price amounted to 122.7%, which means that within the period of ten years their stocks, on average, more than doubled their value. Comparatively, the rate of return of the broad studied sample showed only a 5.6% increase. Regarding profitability, the average returns on assets, equity and sales in human capital orientated firms were positive: 7.1%, 15.6% and 9.2% respectively.
Table 4. Human capital orientated firms and benchmarking sample – general results (2007-2017)
|
HC firms |
Benchmarking sample (n=7245)** |
|
|
Return on investment |
+122.7% |
+5.6% |
|
ROA |
+7.1% |
-6.2% |
|
ROE |
+15.6% |
-4.7% |
|
ROS |
+9.2% |
+1.5% |
|
?Revenue |
+99.5% |
+55.6% |
|
?Net income |
+79.2% |
+7.5% |
|
?Equity |
+91.1% |
+49.4% |
Note: * human capital orientated firms (weighted average of both 2012 and 2017 listing); ** weighted average for 11 industries.
However, in the case of the studied sample, the average profitability during the analyzed period for all entities was negative in terms of ROA (-6.2%) and ROE (-4.7%). Only ROS was positive (+1.5%) but was, however, much lower than in the case of human capital orientated firms. In terms of growth, both groups of studied companies returned positive values; however, increases in revenue, equity and net income were much higher in the case of human capital orientated firms than the benchmarking sample. The greatest difference was observed in the case of net income growth. During 2007-2017, human capital orientated firms increased their net income on average by 79.2%, while the benchmarking sample by only 7.5%.
Detailed profitability results of the benchmarking group, by industry, are presented in Table 5.
As stated before, mean values of ROA, ROE and ROS in the entire analyzed period were higher in the human capital orientated firms; however, there have been observed minor differences among the given industries. In the case of ROA, firms from only two industries (financials and real estate) performed on average a positive value, whereas nine other industries reported negative values with the greatest one observed in the healthcare industry (-22.8%). Similarly to ROA, average weighted ROE and ROS reported negative values; however the industry breakdown provides more optimistic information, as in the case of ROE, out of 11 studied industries seven of them performed a positive value, while in the case of ROS five. What is interesting is that, although human capital orientated firms outperformed benchmarking sample in the case of average values of ROE, ROE and ROS, some studied industries performed better in the case of given indices (health care in the case of ROE and financials in the case of ROS). Meanwhile, the analyses of share prices show that human capital orientated firms provide larger stock returns than all industries.
Table 5. Human capital orientated firms and benchmarking sample - profitability results by industry
|
Mean ROA2007-2017 |
Mean ROE2007-2017 |
Mean ROS2007-2017 |
Return on investment2007-2017 |
|
|
Mean ROA2007-2017 |
Mean ROE2007-2017 |
Mean ROS2007-2017 |
Return on investment2007-2017 |
|
|
HC firms1 (n=45)* |
+7.9% |
+16.2% |
+10.1% |
+125.0% 86.8% profit 13.2% loss |
|
HC firms2 (n=52)** |
+6.2% |
+14.9% |
+8.1% |
+120.1% 94.6% profit 5.4% loss |
|
Energy (n=592) |
-6.2% |
-1.2% |
+6.5% |
-25.5% 30.2% profit 69.8% loss |
|
Materials (n=444) |
-8.2% |
-1.9% |
+1.2% |
+0.9% 33.7% profit 66.3% loss |
|
Industrials (n=872) |
-2.2% |
+5.0% |
-0.3% |
+26.0% 46.8% profit 53.2% loss |
|
Consumer discretionary (n=961) |
-0.9% |
-67.0% |
-1.0% |
+0.1% 37.0% profit 63.0% loss |
|
Consumer staples (n=325) |
-2.0% |
+5.7% |
-0.3% |
-18.5% 44.5% profit 55.5% loss |
|
Health care (n=1123) |
-22.8% |
+16.9% |
-8.0% |
-22.1% 28.1% profit 71.9% loss |
|
Financials (n=1252) |
+0.9% |
+1.6% |
+16.3% |
+36.5% 63.7% profit 36.3% loss |
|
Information technology (n=1164) |
-7.1% |
+3.3% |
-5.0% |
-3.9% 36.3% profit 63.7% loss |
|
Telecommunication services (n=98) |
-10.8% |
-3.4% |
-6.4% |
+8.7% 35.4% profit 64.6% loss |
|
Utilities (n=135) |
-1.5% |
+4.8% |
+5.6% |
+65.9% 61.9% profit 38.1% loss |
|
Real estate (n=279) |
+0.6% |
+2.5% |
+7.1% |
+43.8% 65.7% profit 34.3% loss |
Note: * refers to the 2012 listing; ** refers to the 2017 listing.
Moreover, human capital orientated firms, both from the 2012 and 2017 listing, perform similarly, not only in the case of total investment return, but also in the case of the number of entities with a positive rate of return (94.6% of firms from the 2012 listing increased their share price within the ten year period, while the analogical percentage for the companies from the 2017 listing amounted to 86.8%). Such high rates, both in terms of share price increase and a number of entities with a positive rate of returns, were not observed in any of the benchmarking industries. In fact, four industries (energy, consumer staples, health care and information technology) displayed a decrease in the value of stocks. Moreover, in the majority of the industries studied (eight), there were more firms with negative rates of return than with positive ones.
The third analyzed pillar, growth performance by industry breakdown, has been presented in Table 6.
Table 6. Human capital orientated firms and benchmarking sample - growth results by industry breakdown
|
?Revenue2007-2017 |
?Net income2007-2017 |
?Equity2007-2017 |
|
|
?Revenue2007-2017 |
?Net income2007-2017 |
?Equity2007-2017 |
|
|
HC firms1 (n=45)* |
+87.9% 92.3% increase 7.7% decrease |
+73.9% 75.0% increase 25.0% decrease |
+81.8% 75.0% increase 25.0% decrease |
|
HC firms2 (n=52)** |
+112.8% 92.6% increase 7.4% decrease |
+85.4% 82.4% increase 17.6% decrease |
+101.9% 75.0% increase 25.0% decrease |
|
Energy (n=592) |
+32.0% 48.0% increase 52.0% decrease |
-108.6% 28.1% increase 71.2% decrease |
+56.4% 54.1% increase 45.9% decrease |
|
Materials (n=444) |
+16.8% 86.2% increase 13.8% decrease |
+15.1% 54.1% increase 45.9% decrease |
+44.5% 61.7% increase 38.3% decrease |
|
Industrials (n=872) |
-29.7% 66.7% increase 33.3% decrease |
+31.1% 59.0% increase 41.0% decrease |
+44.1% 63.4% increase 36.6% decrease |
|
Consumer discretionary (n=961) |
+48.0% 60.6% increase 39.4% decrease |
+26.5% 54.9% increase 45.1% decrease |
+14.4% 49.1% increase 50.9% decrease |
|
Consumer staples (n=325) |
+84.8% 76.8% increase 23.2% decrease |
+53.7% 67.4% increase 32.2% decrease |
+56.7% 60.9% increase 39.1% decrease |
|
Health care (n=1123) |
+116.2% 63.5% increase 36.5% decrease |
-43.6% 51.6% increase 48.4% decrease |
+63.6% 55.4% increase 44.6% decrease |
|
Financials (n=1252) |
+69.0% 57.3% increase 42.7% decrease |
+56.1% 64.9% increase 35.1% decrease |
+79.0% 76.6% increase 23.4% decrease |
|
Information technology (n=1164) |
+70.8% 82.3% increase 17.7% decrease |
-18.9% 51.8% increase 48.2% decrease |
+29.9% 50.4% increase 49.6% decrease |
|
Telecommunication services (n=98) |
+49.3% 56.4% increase 43.6% decrease |
-62.6% 51.2% increase 48.8% decrease |
-6.6% 54.1% increase 45.9% decrease |
|
Utilities (n=135) |
+10.2% 55.6% increase 44.4% decrease |
+84.4% 82.2% increase 17.8% decrease |
+66.4% 83.3% increase 16.7% decrease |
|
Real estate (n=279) |
+81.7% 72.9% increase 27.1% decrease |
+133.1% 70.1% increase 29.9% decrease |
+83.4% 74.4% increase 25.6% decrease |
Note: * refers to the 2012 listing; ** refers to the 2017 listing.
From 2007 till the end of 2016, human capital orientated firms, both from 2012 and 2017 listing, managed to increase their revenue, net income and equity with the largest growths attributed to revenue (+112.8%) and equity (+101.9%) in the case of firms from the 2017 listing. However, human capital orientated companies from the 2017 listing also performed outstanding growth. In terms of the number of entities that recorded growth of revenue, net income and equity, it was found in the majority of them, with the highest numbers attributed in the case of revenue growth (92.6% and 92.3% for 2012 and 2017 listings respectively). Meanwhile, the entities from the 10 benchmarking industries experienced an increase in revenue (the only industry with a revenue decrease was industrials). What is more, one industry (healthcare) performed on average greater revenue growth than human capital orientated firms from the 2012 listing while two industries recorded relatively similar performance. These were consumer staples (+84.8%) and real estate (+81.7%) respectively. In the case of revenue in almost all the studied benchmarking industries, there were more firms that reported an increase in revenue than a decrease; however, the ratios were smaller than in the human capital orientated firms (the only exception was energy industry).
According to net income changes over time, companies from the benchmarking sample performed worst. Four industries (energy, healthcare, information technology and telecommunication services) recorded on average a decrease in net income at the end of 2016 compared to 2007, with the largest one observed in the energy industry (-108.6%). However, in only one industry (energy), were there more entities that performed a decrease in net income. In the rest of the industries, although some of them had average negative values of net income growth, there were more entities with a positive than a negative net income change. However, in the case of net income growth, a surprising phenomenon has been observed, namely one of the industries (real estate) outperformed on average human capital orientated firms, both from the 2012 and 2017 listing (133.1% vs. 73.9% (2012) and 85.4% (2017) respectively), while another industry (utilities) outperformed human capital orientated firms from the 2012 listing (84.4% vs. 73.9%). Similarly, in the changes to revenue and net income during 2007-2017, there have also been observed fluctuations of equity in the benchmarking group and human capital orientated firms. Almost all industries displayed growth (the only exception was telecommunication services). One industry (real estate) recorded even higher growth than human capital orientated firms from the 2012 listing but lower than the ones from the 2017 listing. The difference was also observed in the number of firms recording growth; in the case of the benchmarking sample, there was one industry (consumer discretionary) in which there were more entities recording a decrease in equity than an increase. On average, except for financials and utilities, there were more firms in the human capital orientated sample that recorded growth of equity than in the benchmarking sample.
DISCUSSION
Overall, the hypothesis concerning above average human capital orientated firms performance, is confirmed by the study results, which is in line with the previous studies of Bryl and Truskolaski (2015), Edmans (2009), Nimtrakoon (2015) and Seleim et al. (2007). However, it remains in contrast to the study of Yu et al. (2010).
Nevertheless, the conducted study and its results may be ambiguous and thus important questions may arise. First, one deals with the problem of market valuation growth, which in human capital oriented entities was much higher. One of the possible answers is that superior returns are caused not by employee satisfaction (thus, e.g., better task performance) and, by the result, in higher earnings, but because of inclusion in the 100 Best Companies to Work For list per se. This fact (the firm presents a better image by being included in the well-renowned list) may encourage investors to buy the stocks of Best Companies. As an effect, their valuations have risen. A similar explanatory approach has been proposed by Edmans (2009) in his results discussion. A second question refers to the relation between being human capital orientated and performance. The answer is more than unambiguous. It is possible that companies perform better not because they are a human capital oriented firm, but because they have achieved a certain level of financial performance and, thus, they allow themselves greater human capital spending, and through this, they have become human capital friendly. The answer to that question is crucial and goes beyond the scope of this paper. The third concern relates to the methodological part of the study. There have been two types of companies compared; one type (group) was build up from the carefully chosen entities from the 100 Best Companies to Work For, while the second was a broad group of entities consisting of numerous firms from different industries (however outliers have been excluded). That implies difficulties with comparisons. Consequently, it would be valuable and interesting to compare human capital orientated firms from the 100 Best Companies to Work For with companies from other popular listings. Table 7 shows the results of a comparison between the Fortune 100 (largest US companies regarding revenue), S&P 500 and NASDAQ 100 regarding profitability.
Table 7. Human capital orientated firms, Fortune 100, S&P 500 and NASDAQ 100 profitability results
|
Mean ROA2007-2017 |
Mean ROE2007-2017 |
Mean ROS2007-2017 |
Return on investment2007-2017 |
|
|
HC firms1 (n=45)* |
6.2% |
14.9% |
8.1% |
+120.1% 94.6% profit 5.4% loss |
|
HC firms2 (n=52)** |
7.9% |
16.2% |
10.1% |
+125.0% 86.8% profit 13.2% loss |
|
Fortune 100 2017 |
6.0% |
17.8% |
7.5% |
+20.7% 53.7% profit 46.3% loss |
|
S&P 500 2017 |
6.2% |
15.6% |
10.0% |
+32.4% 63.7% profit 36.3% loss |
|
NASDAQ 100 |
8.1% |
16.4% |
11.5% |
+87.3% 72.0% profit 28.0% loss |
Note: * refers to the 2012 listing; ** refers to the 2017 listing.
The results presented in table 6, in comparison to the initial, previous study, show that human capital orientated firms recorded a relatively similar performance as entities from the Fortune 100, S&P 500 and NASDAQ 100 in terms of profitability. The best score, concerning ROA, ROE and ROS, among all the firms studied in Table 6 was observed in the case of the NASDAQ 100 firms, while the worst score was observed in human capital orientated companies from the 2012 listing; however, the differences were small. What is significant is that human capital orientated firms from the 2017 listing performed best only in one of the profitability indices (stock price). In this case, the difference between human capital orientated firms was great, not only in terms of the total return on investment, but also in terms of the share of profitable firms (the worst performing group were entities from the Fortune 100 in which only 53.7% of firms recorded a positive rate of return during the 10-year study period). Results concerning growth are presented in Table 8.
In terms of revenue growth during 2007-2017, human capital orientated firms from both the 2012 and 2017 listing, outperformed Fortune 100 and S&P 500 firms; however, they recorded much smaller growth than NASDAQ 100 entities. The differences in the performance of human capital orientated firms and NASDAQ 100 companies were much more noticeable regarding net income growth; in this case NASDAQ 100 entities outperformed human capital orientated firms almost four times.
Table 8. Human capital orientated firms, Fortune 100, S&P 500 NASDAQ 100 - growth results
|
? Revenue2007-2017 |
? Net income2007-2017 |
? Equity2007-2017 |
|
|
? Revenue2007-2017 |
? Net income2007-2017 |
? Equity2007-2017 |
|
|
HC firms1 (n=45)* |
+112.8% 92.6% increase 7.4% decrease |
+85.4% 82.4% increase 17.6% decrease |
+101.9% 75.0% increase 25.0% decrease |
|
HC firms2 (n=52)** |
+87.9% 92.3% increase 7.7% decrease |
+73.9% 75.0% increase 25.0% decrease |
+81.8% 75.0% increase 25.0% decrease |
|
Fortune 100 2017 |
+50.2% 77.0% increase 23.0% decrease |
+32.2% 59.5% increase 40.5% decrease |
+57.0% 69.3% increase 30.7% decrease |
|
S&P 500 2017 |
+70.2% 80.6% increase 19.4% decrease |
+76.2% 71.8% increase 28.2% decrease |
+83.8% 74.5% increase 25.5% decrease |
|
NASDAQ 100 |
+286.5% 91.8% increase 8.2% decrease |
+310.0% 86.4% increase 13.6% decrease |
+317.2% 79.8% increase 20.2% decrease |
Note: * refers to the 2012 listing; ** refers to the 2017 listing.
Moreover, the measurement of equity growth indicated similar results; human capital orientated firms (both from 2012 and 2017) managed to record, on average, better scores than entities from Fortune 100, S&P 500 but not better than NASDAQ 100.
To sum up the results, it should be stated that human capital orientated firms achieve above-average financial performance measured by profitability and growth; however the comparison with the US stock market indices or listings of the largest US companies indicates better scores only in terms of stock exchange performance (share price increase and number of profitable entities) and equity growth. In the case of profitability measured by ROA, ROE and ROS, similar results were observed; however, in the case of revenue, net income and equity growth, human capital orientated firms were outperformed by one of the benchmarking index - NASDAQ 100. However, as entities from the Fortune 100, S&P 500 and NASDAQ 100 should not be perceived as average ones (in most cases these are the largest and most well-known world corporations), in this sense, the proposed hypothesis in the paper has been confirmed.
CONCLUSION
This paper aimed to contribute to the human capital research by investigating how a firm’s strategy, orientated at the enhancement and development of human capital, influences the company’s financial performance in comparison to other firms from different industries. Because defining a company as human capital orientated is not an easy task, the author used a well-known list, 100 Best Companies to Work For, that names most employee-friendly and human capital development orientated firms.
First, it should be concluded that being human capital orientated generates higher costs for the firm in the form of, e.g., higher salaries, training and additional benefits; however, the vast majority of the companies identified in the list are profitable. All the measured criteria (ROA, ROE and ROS) recorded strong positive values. Moreover, stock market investors value such companies; a strong average (more than double) share price increase was observed. Also, the vast majority of the studied entities recorded growth in the share price. What is important is that the study revealed that companies, from both the 2012 edition of the 100 Best Companies to Work For and from the 2017 edition, performed well; however, entities from the 2012 listing performed better than the ones from the 2017 listing (time extent of the analysis was the same and differences were small).
Second, human capital orientation leads to above-average financial performance, mainly in the field of equity growth and stock market valuation which may derive from the fact that inclusion on the list stimulates the awareness of investors and portrays a positive image of the company. In that sense, this study provides useful information on the possible directions of stock market investments regarding above-average returns.
Third, the results are consistent with human relations theories and most of the previous studies which argue that employee satisfaction causes greater corporate financial performance, potentially through improved motivation, skills and self-confidence.
In summary, this research has contributed to the field of human capital by focusing on US-based corporations from diversified industrial backgrounds. The paper’s findings provide managers with the answer to the dilemma as to whether investment in employees brings more costs than benefits. As a limitation, the author points out that the analysis referred only to American enterprises and the human capital orientated entities comprised of only 97 firms (however, the benchmarking sample consisted of 7,252 companies). Therefore, the results should be tested in a greater number of companies, and from other countries, to check their validity and generalization possibilities. Especially interesting, would be to compare the financial performance of human capital orientated firms from developing and developed nations.
References
Allen, N. J., & Meyer, J. P. (1990). The measurement and antecedents of affective, continuance, and normative commitment to the organization. Journal of Occupational Psychology, 63(1), 1-18.
Alves, J., Marques, M. J., Saur, I., & Marques, P. (2007). Creativity and innovation through multidisciplinary and multisectoral cooperation. Creativity and Innovation Management, 16(1), 27-34.
Appelbaum, E., Bailey, T., Berg, P., & Kalleberg, A. (2000). Manufacturing Advantage: Why High-performance Work Systems Pay Off. Ithaca, NY: Cornell University Press.
Arthur, J. B., Aiman-Smith, L., & Arthur, J. E. F. B. (2010). Gain sharing and organizational learning: Suggestions over time an analysis of employee. Management, 44(4), 737-754.
Barney, J. B., & Wright, P. M. (1998). On becoming a strategic partner: The role of human resources in gaining competitive advantage. Human Resource Management, 37, 31-46.
Batt, R. (2002). Managing customer services: Human resource practices, quit rates, and sales growth. Academy of Management Journal, 45, 587-597.
Beers, P. J. (2005). Negotiating common ground: Tools for multidisciplinary teams (Unpublished doctoral dissertation). Heerlen: Open Universiteit Nederland.
Black, S. E., & Lynch, L. M. (1996). Human-capital investments and productivity. American Economic Review, 86(2), 263-267.
Bryl, Ł., & Truskolaski, Sz. (2015). The intellectual capital effectiveness and enterprises` performance - empirical study of Polish listed companies using VAIC method. In V., Dermol, A., Trunk, G., ?aković, & M., Smrkolj (Eds.), Managing Intellectual Capital and Innovation for Sustainable and Inclusive Society (pp. 933-942). Bangkok: ToKnowPress.
Buech, V. I. D., Michel, A., & Sonntag, K. (2010). Suggestion systems in organizations: What motivates employees to submit suggestions? European Journal of Innovation Management, 13(4), 507-525.
Bunderson, J. S., & Sutcliffe, K. M. (2002). Comparing alternative conceptualizations of functional diversity in management teams: Process and performance effects. Academy of Management Journal, 45, 875-893.
Chan, C. C. A., Lim, L., & Keasberry, S. K. (2003). Examining the linkages between team learning behaviors and team performance. The Learning Organization, 10(4), 228-236.
Cooper, A. C., Gimeno-Gascon, F. J., & Woo, C. Y. (1994). Initial human and financial capital as predictors of new venture performance. Journal of Business Venturing, 9, 371-395.
Crawford, E. R., & LePine, J. A. (2012). A configural theory of team processes: Accounting for the structure of taskwork and teamwork. Academy of Management Review, 38(1), 32-48.
Culverson, D. E. (2002). Exploring organizational commitment following radical change: A case study within the Parks Canada Agency (Unpublished doctoral dissertation). Waterloo: University of Waterloo.
Du Plessis, A. J., Marx, A. E., & Wilson, G. (2008). Generating ideas and managing suggestion systems in organisations: Some empirical evidence. International Journal of Knowledge, Culture and Change Management, 8(4), 133-140.
Durrani, T. S., & Forbes, S. M. (2003, November). Intellectual capital and technology strategy. Paper presented at the IEMC Conference on Managing Technologically Driven Organizations: The Human Side of Innovation and Change.
Edmondson, A., Bohmer, R. M., & Pisano, G. P. (2001). Disrupted routines: Team learning and new technology implementation in hospitals. Administrative Science Quarterly, 46, 685-716.
Ellis, A. P. J., Hollenbeck, J. R., Ilgen, D. R., West, B. J., Porter, C. O. L. H., & Moon, H. (2003). Team learning: Collectively connecting the dots. Journal of Applied Psychology, 88(5), 821-835.
Fairbank, J. F., & Williams, S. D. (2001). Motivating creativity and enhancing innovation through employee suggestion system technology. Creativity and Innovation Management, 10(2), 68-74.
Gimeno, J., Folta, T., Cooper, A., & Woo, C. (1997). Survival of the fittest? Entrepreneurial human capital and the persistence of underperforming firms. Administrative Science Quarterly, 42, 750-783.
Guenther, T., Beyer, D., & Menninger, J. (2003). Hurdles for the voluntary disclosure of information on intangibles – empirical results for ‘New Economy’ industries. Dresden Papers of Business Administration, 71(3), 1-35.
Hertzberg, F. (1959). The Motivation to Work. New York, NY: John Wiley & Sons.
Huselid, M. (1995). The impact of human resource management practices on turnover, productivity, and corporate financial performance. Academy of Management Journal, 38(3), 635-672.
Islam, R. (2007, August). Evaluation of suggestions by the analytic hierarchy process: A case study on a public university in Malaysia. Paper presented at the 9th International Symposium on the Analytic Hierarchy Process for Multi-Criteria Decision Making.
Kochan, T. A., & Dyer, L. (2017). Shaping the Future of Work: A Handbook for Action and a New Social Contract. Cambridge, MA: MIT Press.
Lepak, D. P., & Snell, S. A. (1999). The human resource architecture: Toward a theory of human capital allocation and development. Academy of Management Review, 24, 31-48.
Lepak, D. P., & Snell, S. A. (2002). Examining the human resource architecture: The relationships among human capital, employment, and human resource configurations. Journal of Management, 28, 517-543.
Loi, R., Ngo, H. Y., & Foley, S. (2006). Linking employees’ justice perceptions to organizational commitment and intention to leave: The mediating role of perceived organizational support. Journal of Occupational and Organizational Psychology, 79(1), 101-120.
Luthans, F., McCaul, H. S., & Dodd, N. G. (1985). Organizational commitment: A comparison of American, Japanese, and Korean employees. The Academy of Management Journal, 28(1), 213-219.
Lynham, S., & Cunningham, P. (2006). National human resource development in transitioning societies in the developing world: Concept and challenges. Advances in Developing Human Resources, 8(1), 116-135.
Madjar, N. (2005). The contributions of different groups of individuals to employees’ creativity. Advances in Developing Human Resources, 7(2), 182-206.
Maslow, A. (1943). A Theory of Human Motivation. Psychological Review, 50, 370-396.
Mathieu, J., Maynard, M. T., Rapp, T., & Gilson, L. (2008). Team effectiveness 1997-2007: A review of recent advancements and a glimpse into the future. Journal of Management, 34(3), 410-476.
McConville, J. (1990). Innovation through involvement. The TQM Magazine, 2(5), 295-297.
McGregor, D. (1960). The Human Side of Enterprise. New York, NY: McGraw-Hill.
McGregor, J., Tweed, D., & Pech, R. (2004). Human capital in the new economy: Devil’s bargain? Journal of Intellectual Capital, 5(1), 153-164.
Mention, A. L., & Bontis, N. (2013). Intellectual capital and performance within the banking sector of Luxembourg and Belgium. Journal of Intellectual Capital, 14(2), 286-309.
Meijerink, J., Bondarouk, T., & Looise, J. K. (2013). Value creation through HR shared services: Towards a conceptual framework. Personnel Review, 42(2), 154-175.
Meyer, J. P., Allen, N. J., & Gellatly, I. R. (1990). Affective and continuance commitment to the organization: Evaluation of measures and analysis of concurrent and time-lagged relations. Journal of Applied Psychology, 75, 710–720.
Nafukho, F. M., Hairston, N. R., & Brooks, K. (2004). Human capital theory: Implications for human resource development. Human Resource Development International, 7(4), 545-551.
Neagoe, L. N., & Klein, V. M. (2009). Employee suggestion system (Kaizen Teian) the bottom-up approach for productivity improvement. Control, 10(3), 26-27.
Ndinguri, E., Prieto, L., & Machtmes, K. (2012). Human capital development dynamics: The knowledge based approach. Academy of Strategic Management Journal, 11(2), 121-136.
Nimtrakoon, S. (2015). The relationship between intellectual capital, firms’ market value and financial performance. Journal of Intellectual Capital, 16(3), 587-618.
Oviedo-Garcia, M. A., Castellanos-Verdugo, M., Garcia Del Junco, J., & Riquelme-Miranda, A. (2014). Organizational learning capacity and its impact on the results in a government agency in Chile. International Public Management Journal, 17(1), 74-110.
Pfeffer, J. (1994). Competitive Advantage Through People: Unleashing the Power of the Work Force. Boston, MA: Harvard Business School Press.
Pfeffer, J. (1998). The Human Equation: Building Profits by Putting People First. Boston, MA: Harvard Business School Press.
Porter, M. E. (2001). Strategy and the Internet. Harvard Business Review, 79(3), 62-78.
Prahalad, C. K., & Hamel, G. (1990). The core competence of the corporation. Harvard Business Review, 68(3), 79-91.
Randall, D. M., (1987). Commitment and the organization: The organization man revisited. The Academy of Management Review, 12(3), 460-471.
Roos, G., Bainbridge, A., & Jacobson, K. (2001). Intellectual capital analysis as a strategic tool. Strategy and Leadership Journal, 29(4), 21-26.
Sánchez, A. A., Marín, G. S., & Morales, A. M. (2015). The mediating effect of strategic human resource practices on knowledge management and firm performance. European Journal of Management & Business Economics, 24(3), 138-148.
Seleim, A., Ashour, A., & Bontis, N. (2007). Human capital and organizational performance: A study of Egyptian software companies. Management Decision, 45(4), 789-801.
Sels, L., De Winne, S., Maes, J., Delmotte, J., Faems, D., & Forrier, A. (2006). Unravelling the HRM-performance link: Value-creating and cost-increasing effects of small business HRM. Journal of Management Studies, 43(2), 319-342.
Snell, S. A., & Dean, J. W. (1992). Integrated manufacturing and human resource management: A human capital perspective. Academy of Management Journal, 35, 467-504.
Stewart, T. A. (1999). Intellectual Capital: The New Wealth of Organizations. New York, NY: Currency Doubleday.
Sveiby, K. E. (1997). The New Organizational Wealth: Managing and Measuring Knowledge Based Assets. San Francisco, CA: Berrett-Koehler Publishers.
Vidotto, J. D. F., Ferenhof, H. A., Selig, P. M., & Bastos, R. C. (2017). A human capital measurement scale. Journal of Intellectual Capital, 18(2), 316-329.
Wright, P. M., Dunford, B. B., & Snell, S.A. (2001). Human resources and the resource based view of the firm. Journal of Management, 27, 701-721.
Yu, K. Y., Ng, H. T., Wong, W. K., Chu, S. K. W., & Chan, K. H. (2010). An empirical study of the impact of intellectual capital performance on business performance. Journal of Information & Knowledge Management, 10(1), 11-21.
Abstrakt
W gospodarce opartej na wiedzy kluczową rolę w osiąganiu dodatnich wyników finansowych i utrzymania przewagi konkurencyjnej pełni kapitał ludzki. Rozważania naukowe zwracają uwagę, że przedsiębiorstwa w większym stopniu zorientowane na kapitał ludzki (ang. human capital orientated firms), czyli takie, które m. in. przeznaczają więcej środków na rozwój swoich pracowników, oferują wyższe wynagrodzenia i bogatszy pakiet świadczeń dodatkowych oraz cechują się transformacyjnym stylem zarządzania mogą generować lepsze wyniki finansowe aniżeli firmy zorientowane na kapitał ludzki w mniejszym stopniu, co wynika z: lepszych umiejętności pracowników, ich większej motywacji oraz wyższej całkowitej efektywności organizacji. W artykule postawiono dwa cele naukowe. Pierwszym z nich było stwierdzenie, że firmy zorientowane na kapitał ludzki generują dodatnie wyniki finansowe, natomiast drugim celem było porównanie wyników finansowych firm zorientowanych na kapitał ludzki z tzw. szerokim rynkiem w celu stwierdzenia, czy wyniki finansowe przedsiębiorstw zorientowanych na kapitał ludzki są ponadprzeciętne. Badania przeprowadzono wśród 7204 spółek notowanych na amerykańskiej giełdzie papierów wartościowych w okresie dziesięciu lat. W celu identyfikacji firm zorientowanych na kapitał ludzki wykorzystano listę 100 Best Companies to Work For zgodnie z metodologią zaproponowaną przez Edmansa (2009). Drugą grupę stanowiły amerykańskie przedsiębiorstwa notowane na giełdzie pochodzące z 11 branż. Kluczowe wnioski płynące z tego opracowania są następujące: strategia oparta na orientacji na kapitał ludzki umożliwia osiąganie nie tylko pozytywnych ale także ponadprzeciętnych wyników finansowych, głównie w zakresie: wzrostu wartości akcji i kapitałów własnych. Artykuł ma istotne implikacje praktyczne dla inwestorów w zakresie pożądanych kierunków inwestycji giełdowych, których celem jest osiągnięcie ponadprzeciętnych zysków. Co więcej, badanie wykazało, że strategia zorientowana na kapitał ludzki, mimo ponoszenia wyższych kosztów, jest opłacalna dla przedsiębiorstw. Artykuł wypełnia lukę badawczą dwojako. Po pierwsze, wskazuje, w których obszarach związanych z wynikami finansowymi przedsiębiorstwa zorientowane na kapitał ludzki radzą sobie najlepiej. Po drugie, porównuje wyniki strategii ukierunkowanej na kapitał ludzki z wynikami firm z 11 różnych branż. Badania dotyczyły amerykańskich przedsiębiorstw giełdowych.
Słowa kluczowe: gospodarka oparta na wiedzy, kapitał ludzki, wyniki finansowe, korporacje międzynarodowe.
Biographical note
Łukasz Bryl is a Doctor of economic sciences and an Assistant Professor in the Department of International Economics at the Poznan University of Economics and Business. His research interests include intellectual capital identification, measurement and reporting, as well as enterprise valuation and new economy.
1 Such a dichotomous division is not entirely correct, however for the needs of the theoretical part of this paper, the author will use a two-dimensional, strongly opposite classification.
2 The outliers in the stock market and growth pillars (indices: return on investment, revenue, equity and income growth) have been determined based on quartile 1, 3 and interquartile range. Inner lower and upper fences have been considered in the study. In terms of the profitability pillar (indices: ROS, ROE and ROA) the outliers have been estimated as |100%|.
3 100 Best Companies to Work For was first published in 1998 and since that time has been released every year.
4 In this case, companies being in any of the studied indices (Fortune 100, S&P 500 and NASDAQ 100) and on the 100 Best Companies to Work For list, were not excluded from the study.